For Brand Leaders
Grow brand value by ensuring content remains relevant over time and resonates with target audiences.
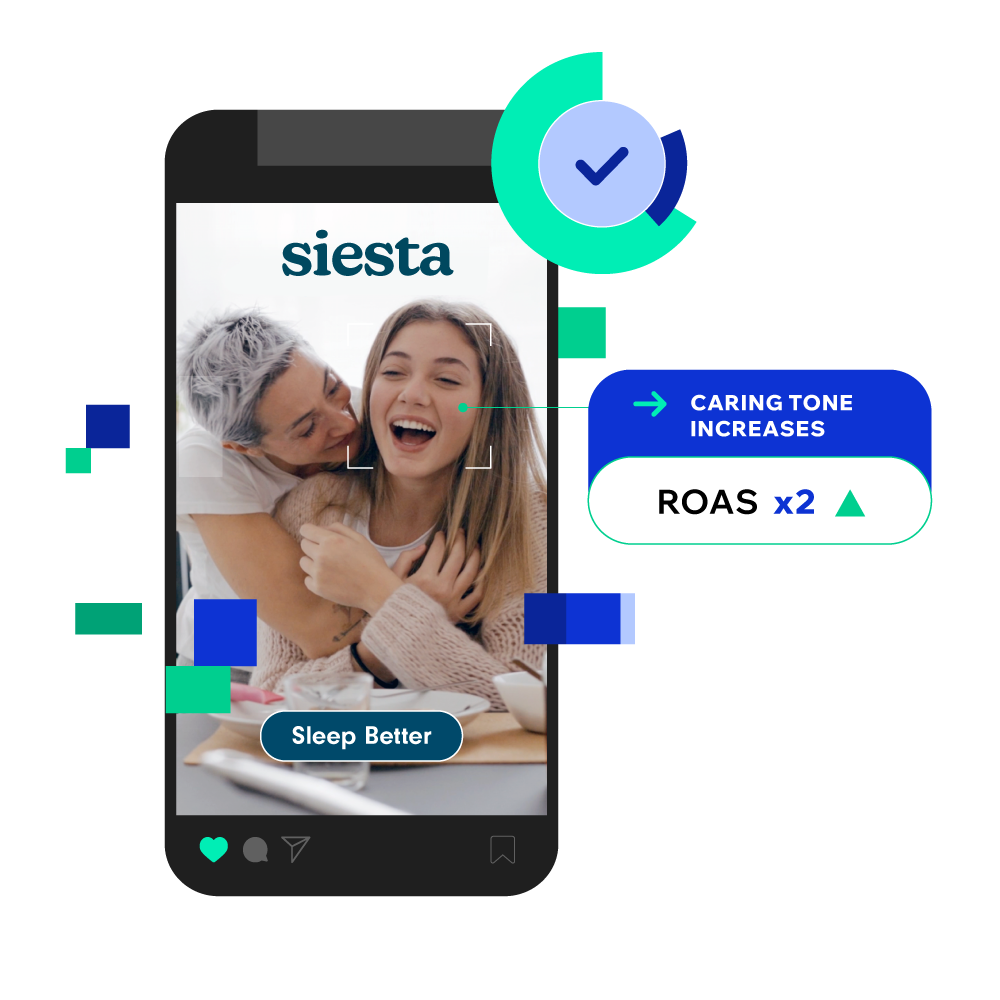
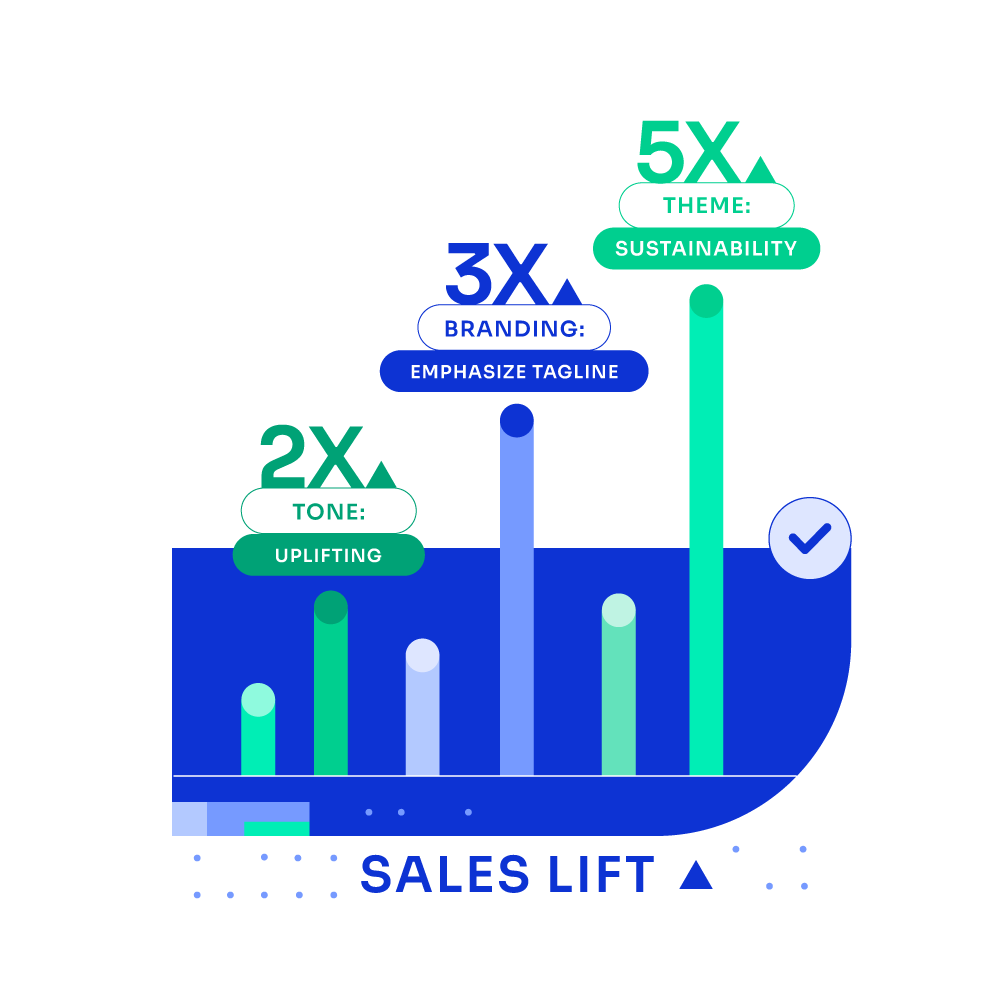
Track audience responses to different creative strategies, messaging, and brand claims to learn which creative strategies are helping or hurting ad performance.

For Creative Leaders
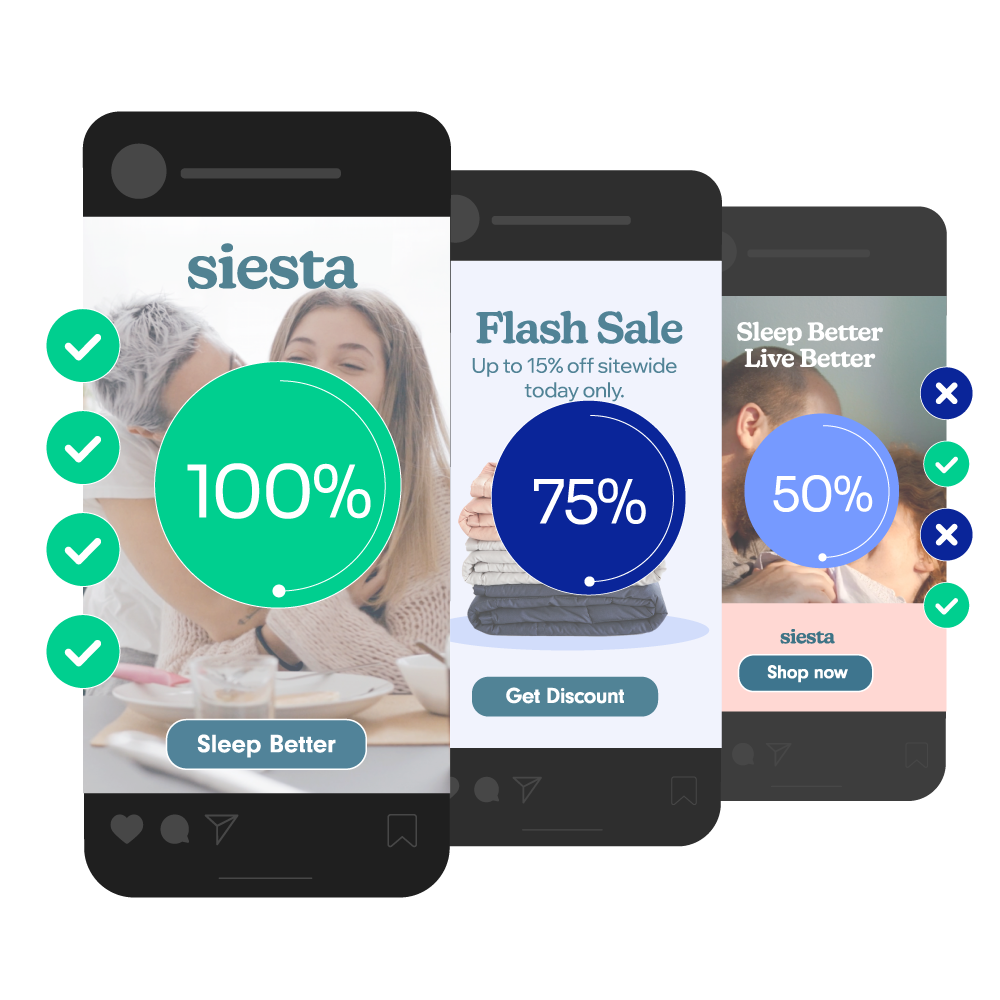
Stop guessing about what works. Track audience responses to different creative strategies and learn which are most effective. Then use those learnings to inform your next brief.
With Creative Analytics, you can finally quantify creative impact by connecting creative to business outcomes.

For Media Leaders
Avoid wasting media dollars in underperforming assets. You can use creative analytics to predict which ads are going to work before a single impression has been served.
Improve programmatic media decisioning by using creative quality and predictive scores as inputs.

For Agencies
Win more pitches and open up new service opportunities by offering Vidmob's AI-powered analytics and measurement services.
Partner with Vidmob to build a sustainable, competitive advantage for your clients — and your agency — as well as get access to the latest AI and ML tech to stay on top of key market trends.