The VidMob Gives Impact Score

How well is VidMob Gives living up to its ambitious goals to create meaningful impact? That is the question that Justin Mon and I set out to answer with our capstone project as VidMob interns. For our project, Justin and I worked closely with Burr Purnell, the Executive Director of Social Good at VidMob, to develop the Gives Impact Score. The score that we created is a quarterly score meant to reflect how well Gives is performing relative to its goals.
The project originated from Burr’s long-standing desire to internally quantify how well VidMob Gives is executing its goals and leveraging the VidMob creative team and Creative Intelligence tool to efficiently create impactful videos for non-profits—all while broadcasting messages of social good to the VidMob community and the world as a whole.
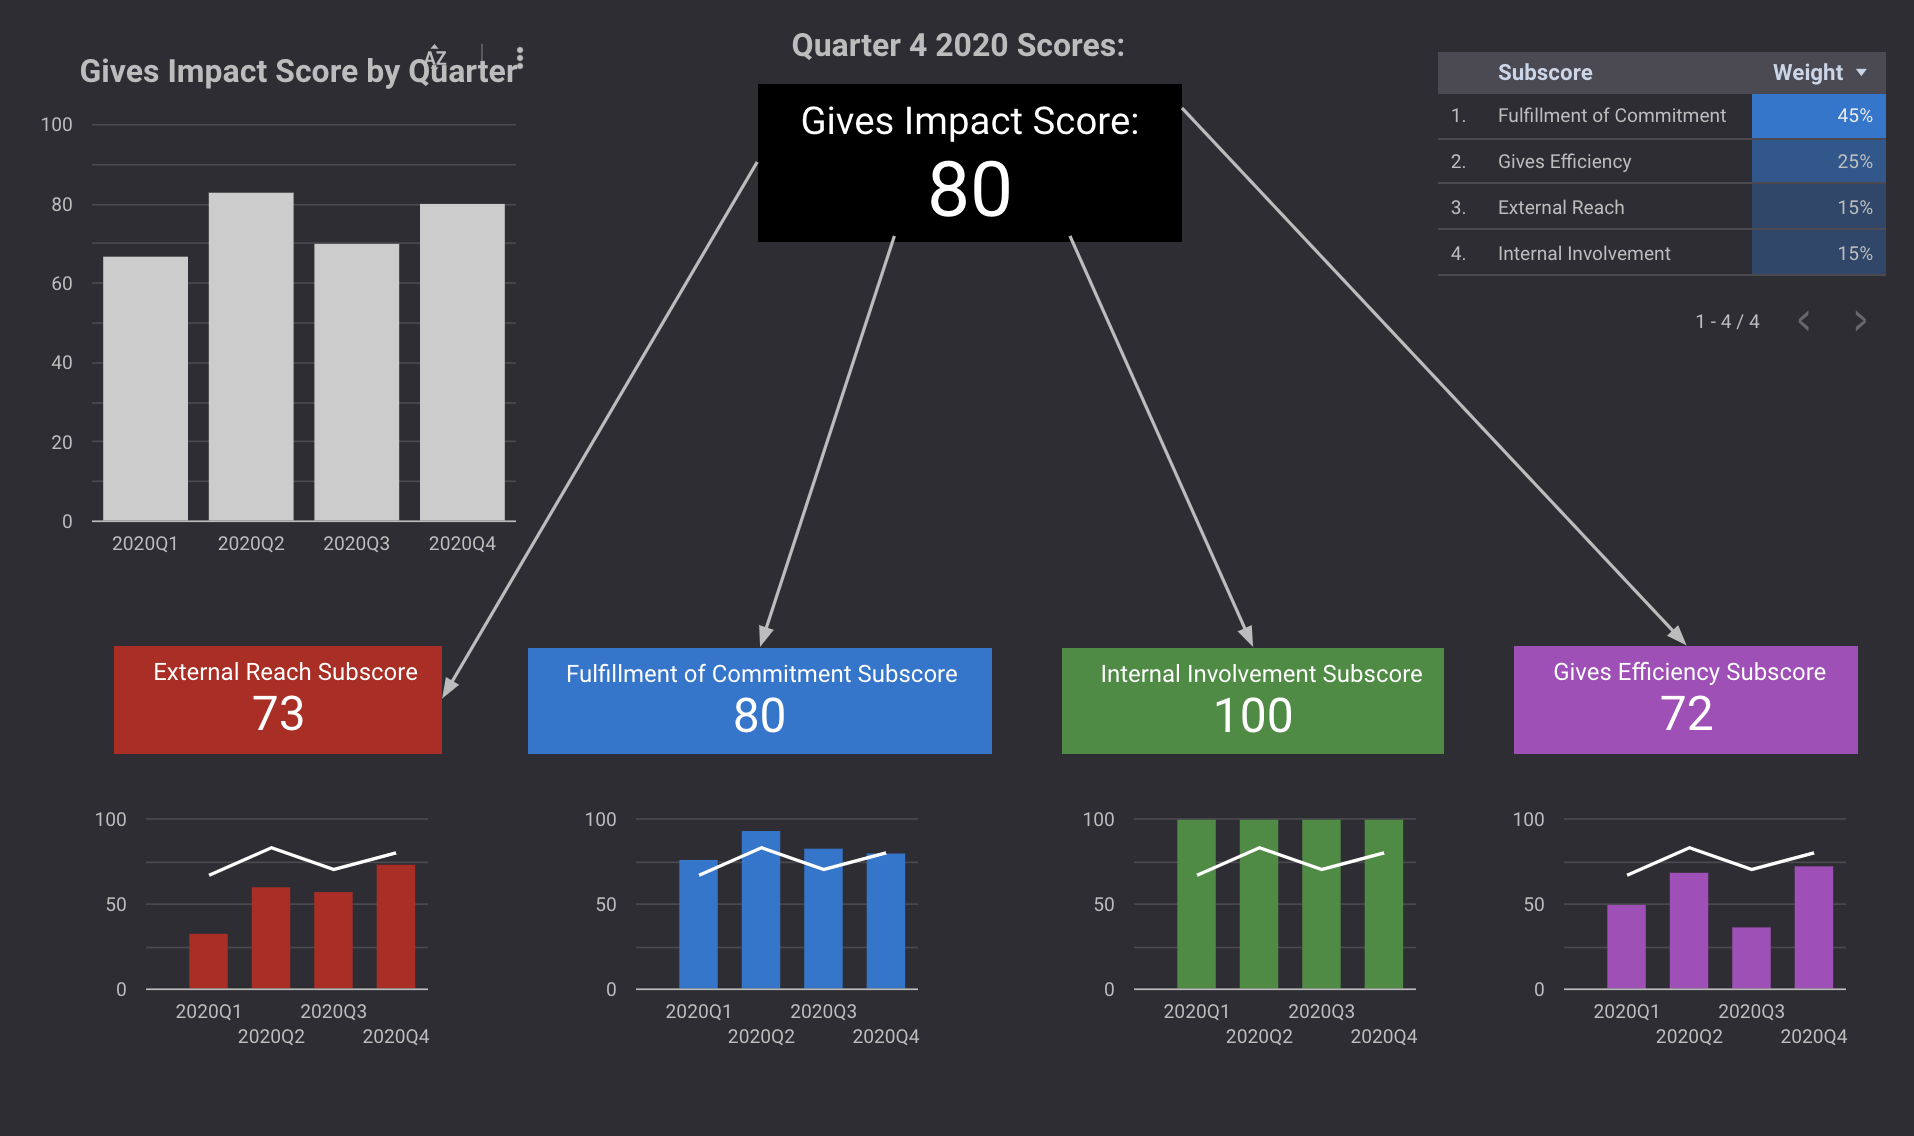
After evaluating the necessary criteria, we developed a scale (0-100) that determines the Gives Impact Score. If at any moment in time VidMob Gives scores 100, it is fulfilling its goals to the fullest extent. The score is a weighted average of four subscores, each of which corresponds to a different component of the Gives mission. The four subscores are:
- External Reach: Measures how well VidMob Gives is sharing its work and the work of NPOs with the world
- Fulfillment of Commitment: Measures how well Gives is living up to its mission to serve “a diverse array of non-profits” around the world
- Internal Involvement: Measures to what extent VidMob’s employees are engaged with and working with Gives
- Vidmob Gives Efficiency: Measures how time and labor intensive Gives projects are relative to VidMob’s non-Gives projects
Each of these four subscores is comprised of a number of different data points that serve as indicators of how well VidMob Gives is meeting its goals. Each data point is assigned a weight within the subscore, with the more representative and important data points holding more weight. Each subscore is evaluated out of 100. The final score is a weighted average of the four subscores, with Fulfillment of Commitment making up 45% of the total score, Gives Efficiency accounting for 25%, and External Reach and Internal Involvement each being worth 15%. The score’s breakdown with data point and subscore weights can be seen below.

After constructing the framework, Justin and I were able to calculate the final score for each quarter of 2020. In Q4 of 2020, the overall Gives Impact Score was 80. Subscores were as follows:
- External Reach: 73
- Fulfillment of Commitment: 80
- Internal Involvement: 100
- Gives Efficiency: 72
The overall score of 80 was up ten points from the Q3 score of 70 but slightly lower than the 2020 high score of 83 from Q2. A visualization of the 2020 scores and subscores that we created is shown below.
We also created subscore specific visualizations, as well as visualizations that dove deeper into the demographic and geographic breakdown of Gives projects. A condensed version of our visualizations can be seen below. On the right, the proportion of Gives outputs that touch on each UN Sustainable Development Goal is shown, along with a map of which countries have been impacted by the work of VidMob Gives. We also looked at Gives outputs by platform, which can be seen directly above the map. Our subscore-specific visualizations are found in the middle of the page and are color-coded to reflect their corresponding subscore. The demographic breakdowns, which look at the editor, project manager and creative director roles, are on the left of the visualization and showcase the ethnicity and gender of the VidMob staff assigned to different Gives campaigns. At VidMob, we believe that staff diversity is crucial to developing high-quality creative that will resonate with large audiences, so these visualizations help hold VidMob accountable to this diversity standard.
Going forward, each data point will be collected quarterly and input into our model. The score calculations on the spreadsheet are automated, meaning minimal work will need to be done every quarter to keep our score up to date. The model that Justin and I created will outlive our time as interns at VidMob, which to me is really neat. It feels good to leave a legacy behind that will help Burr and the VidMob Gives team better evaluate their performance and potential areas for improvement in the coming years.
Working on the capstone has been one of the most meaningful, and also one of the most educational, parts of my internship. I was able to simultaneously refine my skills in Excel, data visualization, and data analysis, all while serving a company need and creating something that I hope will make a positive impact on the mission of many non-profit organizations in the coming years. To me, my capstone perfectly encapsulated VidMob’s ethos of “evolving creativity for the better.” Justin and I were able to use our existing skills—while building some new ones—to create a tool that we hope will help make the company and the world a better place.
Most Popular

Designing Creative for the Multichannel Experience
popular_posts_widget Read MoreMost Recent


